Table of Contents
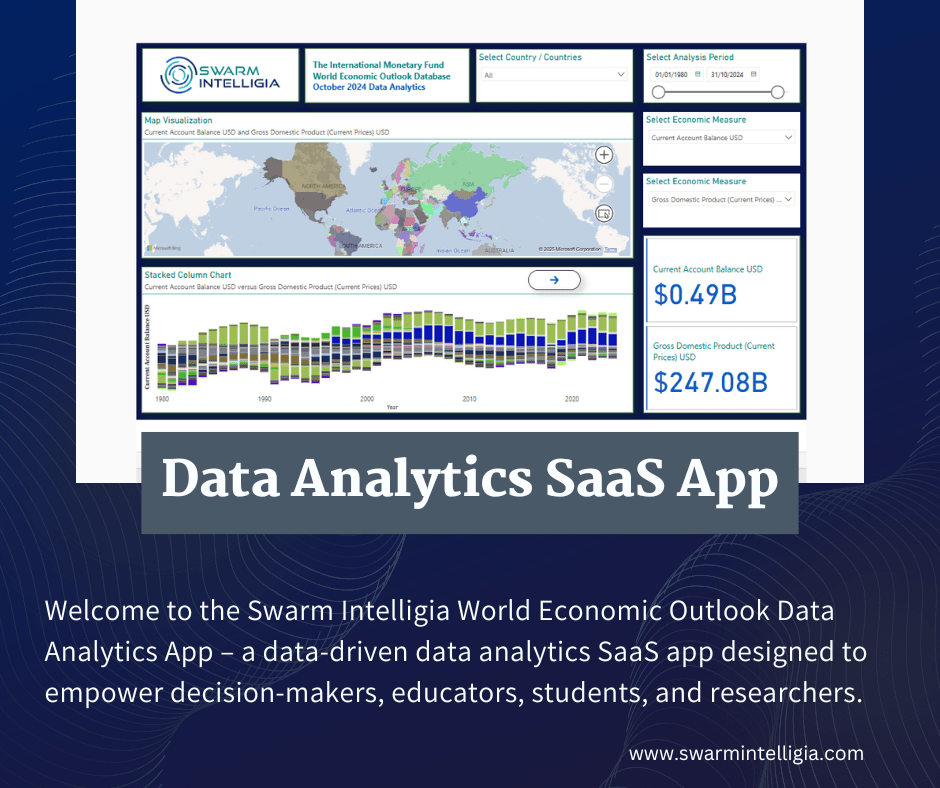
Welcome to the Swarm Intelligia World Economic Outlook Data Analytics Application – a data-driven data analytics app designed to empower decision-makers, educators, students, and researchers. This web-based application serves as a decision support, research, and education platform, offering interactive data analysis and visualisation of macro-economic data spanning 196 countries and 28 macro-economic indicators across multiple regions. Our commitment to mobile-first design, ensures that users can access critical macro-economic analysis insights whether at home, in the office, or on the move.
The World Economic Outlook Data Analytics App is a Data Analytics Software-as-a-Service (SaaS) Application developed and maintained by Swarm Intelligia. The App provides analytics of the International Monetary Fund, World Economic and Financial Surveys, World Economic Outlook Database – October 2024 Edition data: World Economic Outlook Database, October 2024.
The World Economic Outlook (WEO) Database contains selected macroeconomic data from the statistical appendix of the World Economic Outlook – All Issues report, which presents the IMF staff’s analysis and projections of economic developments at the global level, in major country groups and in several individual countries. The WEO is released in April and September/October each year.
The database contains data on national accounts, inflation, unemployment rates, balance of payments, fiscal indicators, trade for countries and country groups, and commodity prices whose data are reported by the IMF.
The database contains data from 1980 to the present, and includes projections provided by the IMF staff for the next two years. Additionally, the data includes medium-term projections for selected economic indicators. For some countries, data are incomplete or unavailable for certain years.
Source: International Monetary Fund, World Economic and Financial Surveys, World Economic Outlook Database – October 2024 Edition, World Economic Outlook Database WEO Data: October 2024 Edition.
The App offers a robust, yet user-friendly interface that supports interactive data exploration. Built with modern web technologies, the platform provides seamless performance across desktop and mobile devices. It is specifically designed to allow users to query, analyse, visualise, and consume data with ease, making it an indispensable tool for a diverse range of analytical tasks.
The World Economic Outlook Data Analytics App was created as an extension of the World Economic Outlook Database – October 2024 Data Analytics Power BI Report, developed and maintained by Swarm Intelligia in Microsoft Power BI and hosted in the Power BI Service. The report is available on Swarm Intelligia’s website at Analytics – Swarm Intelligia.
We created the report and the app as a decision-support, research, and education analytics tool. The app is designed to provide an interactive data analysis and visualisation environment where decision-makers, educators, students, and researchers can analyse and visualise economic data to facilitate decision-analysis, teaching, learning, and scientific research applications.
Use case applications include:
- Decision-analysis: Businesses and institutions may use the App to analyse macro-economic fundamentals of countries in which they operate or may be seeking to operate.
- Education: Educators may use the App as a teaching tool to facilitate teaching of macro-economic analysis and environmental analysis concepts.
- Learning: Students studying social sciences might use the App to analyse the macro-economic performance of countries in an economic region based on specified economic indicators.
- Research: Researchers conducting research in economics, mathematics, or statistics and related disciplines might use the App to carry out interactive data analysis of select economic indicators to enhance their understanding of the performance of countries and/or regions which might be the focus of their research.
In each use-case, the App facilitates interactive data analysis of the macro-economic performance of 196 countries across 28 economic indicators and various economic regions.
To access and use the World Economic Outlook Data Analytics App visit: ComSysPsi.
The App comprises five sections.
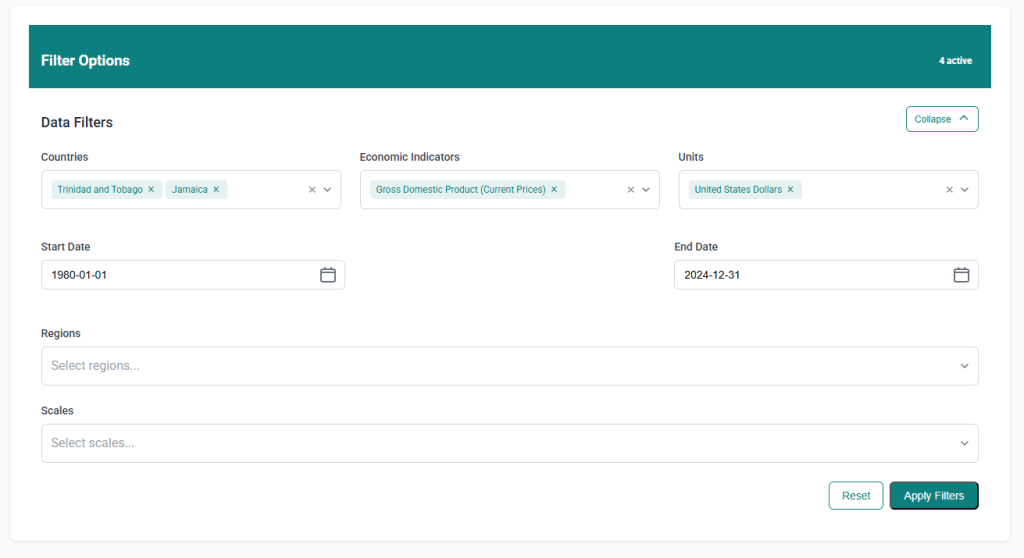
The first section of the App is the Filter Options Panel. Use the Filter Options to query the database based on select criteria for Countries, Economic Indicators, Units, Data Analysis Date Ranges, Regions, and Scales.
The panel ensures that your analysis is precisely tailored to the slice of the data of interest to your analysis.
Countries
The database comprises macroeconomic data for 196 countries. Select the countries of interest by typing in the country name in the search box, or by scrolling through the list of available countries.
Multiple countries can be included in your analysis by selecting the checkbox to the left of the country name.
To remove a country from your analysis, simply click the x to the right of the country name and the country will be removed from the selection.
Economic Indicators
The database comprises 28 macroeconomic indicators in various Units of measurement. To select a macroeconomic indicator, simply type the name of the economic indicator into the search box or scroll down the list and select the indicator by checking the box to the left of the indicator name.
As with countries, multiple economic indicators can be selected. To remove an economic indicator from your analysis, simply click the x to the right of the indicator name and it will be removed from the selections.
Units
Economic Indicators are measured in Units, for example, National Currency, Percent of GDP, or United States Dollars. To see a full list of available Units, scroll down the list.
To select a Unit of measurement for an Economic Indicator simply type the Unit name or scroll down the list and select the Unit by checking the box to the left of the Unit name.
To remove a Unit from the selection, simply click the x to the right of the Unit name.
Start Date
The database comprises data for 50 years for the period 1980 – 2029. To select a date range for analysis, simply select a start date by clicking the calendar icon under the Start Date filter option.
End Date
To select an end date for your analysis, select the calendar icon under the End Date filter option and select your preferred end date for the analysis period.
Regions
Regions represent economic areas as determined by the International Monetary Fund staff. For a complete list of available regions, scroll down the list.
To select an economic region for analysis, simply type the name of the region or select it from among the available list.
To remove a region from your analysis, simply click the x to the right of the region name and remove it from the selection.
Scales
There are three available scales in the database, Billions, Millions, and Units. Whilst a scale can be selected, it is not necessary to do so, as selecting the Economic Indicator and Units will automatically select the appropriate scale.
Once you have selected your filter preferences, select the Apply Filters button to apply your filter preferences to the Data Visualisation and the Data Table.
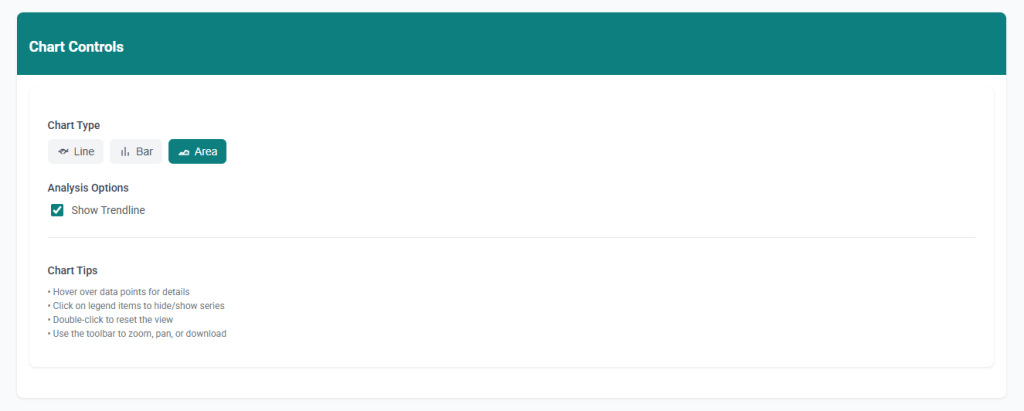
Chart Type
Use the Chart Controls to select the type of chart visual you wish to display. Select from among three available chart types: Line, Bar, and Area charts.
This feature allows for a flexible and dynamic approach to data analysis and data visualisation.
Analysis Options
The Show Trendline option applies linear regression to the selected Economic Indicator for each Country selected in the Filter Options. Machine learning creates a projection of the selected Economic Indicator for the selected analysis period.
The Statistical Analysis panel provides summary statistics for the selected Economic Indicators based on selections made in the Filter Options Panel.

Summary statistics are calculated across all selections in the Filter Options Panel, i.e., for the selected Economic Indicators, Countries, Units, Date Range, Region, and Scale selections.
In the example above, the summary statistics are calculated in Units: United States Dollars and Scale: Billions.
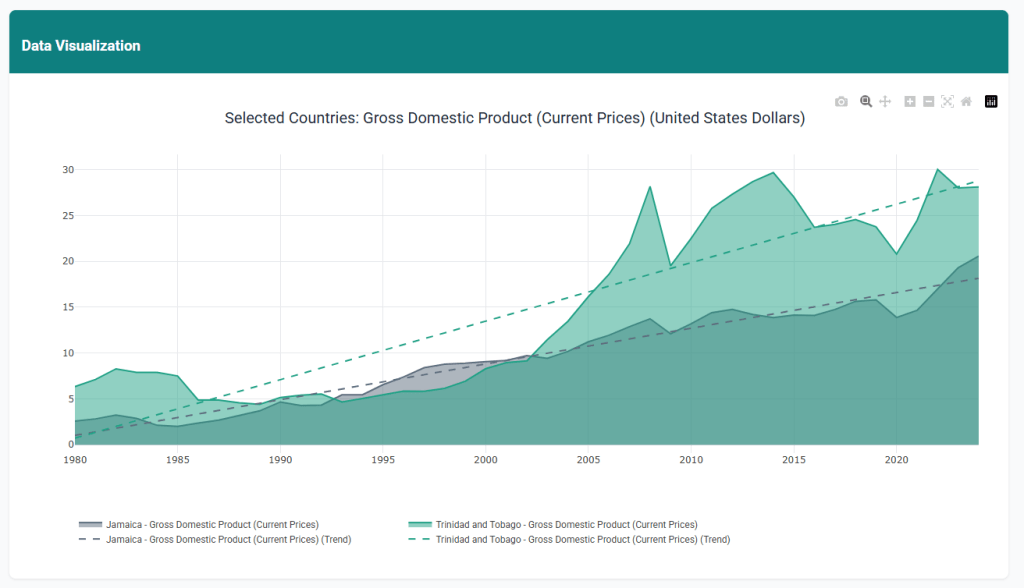
The Data Visualisation pane displays the data visualisation for the selected Filter Options and the Chart Type and Analysis Options selected within the Chart Controls panel.
To download a copy of the data visualisation, select the camera icon in the top right corner of the visualisation pane.
To view details of the data visualisation, hover over the data points of the visualisation. A Tooltip illustrates the details for each data point.
The Data Table pane provides a data table comprising the attributes and values for the selections made in the Filter Options Panel.
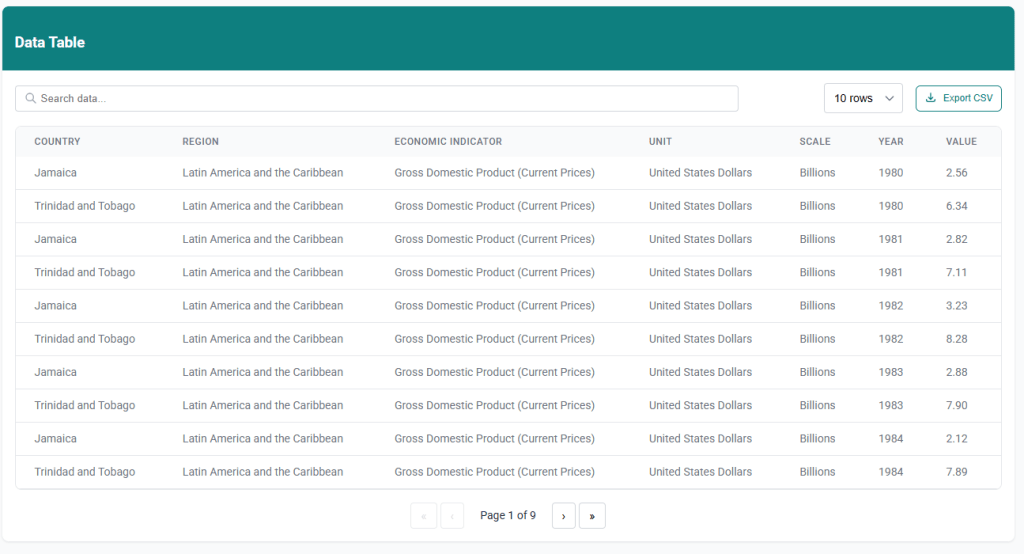
Several options are available for filtering and working with the data in the Data Table.
Search Data
Use the search data section of the data table to filter the data based on specified attribute values. Filter the data by Country, Region, Economic Indicator, Units, Scale, Year, or search for a specific Value.

Row Button
Use the row selection button to change the number of rows to display. Select between 5, 10, 20, and 50 rows of data to display at a time in the data table.

Export CSV
To download a copy of the filtered data as a CSV file, use the Export CSV button.

This downloads a copy of the filtered data to your local computer for offline analysis in tools such as Microsoft Excel.
Pagination
To view additional pages of data in the Data Table use the Pagination at the bottom of the Data Table. Navigate to a single page at a time or navigate to the end or the beginning of the Data Table using the navigation buttons.

To ensure a smooth introduction to the Application, we offer a comprehensive onboarding process which includes:
- Interactive Tutorials: Step-by-Step guides that familiarise users with the application’s features.
- Walkthroughs: Interactive demonstrations for navigating key functionalities such as data filtering, chart selection, and analysis options.
These resources are designed to assist new users at becoming proficient at maximising the value to be derived from the platform.
We prioritise the security and privacy of our data. The application has been built with Enterprise-grade security measures to protect sensitive information and ensure compliance with relevant data protection regulations. For additional information regarding our Data Privacy and Terms of Use visit: Data Privacy and Terms of Use.
The World Economic Outlook Data Analytics App has been developed by Swarm Intelligia to facilitate economic data analysis of the World Economic Outlook Database – October 2024 Edition Data: World Economic Outlook Database, October 2024.
The App has been developed as an analytics solution to facilitate and promote the advancement of scientific decision-making, education, and research and development in the fields of advanced analytics, machine learning, and artificial intelligence across the Latin American and Caribbean Region.
Use-case applications include Economic Analysis, Educational Demonstrations and Teaching, and Market Research and Environment Analysis among others.
To begin using the Swarm Intelligia World Economic Outlook Data Analytics Application visit: ComSysPsi. There is no requirement to register or create an account to use the App. Simply start analysing and interacting with the data.
For questions and feedback concerning the App, contact our support team at solutions@swarmintelligia.com. A regularly updated FAQ section is available at Frequently Asked Questions.
ComSysPsi is the research and development function of Swarm Intelligia. Our focus is the advancement of scientific research and development in the areas of Advanced Analytics, Machine Learning, and Artificial Intelligence across the Latin American and Caribbean Region.
Established in 2024, the function comprises researchers, scientists, and developers with expertise in Advanced Data Analytics, Machine Learning, Artificial Intelligence, and Application Development.


